
Presentation Matters
Good management - financial management - is done with numbers. The quality of management's numbers - timeliness, accuracy, completeness and relevance - is at the heart of business growth and success.
HOW financial information is presented is central in its value to management. Advancing technology now enables a revolution in presentation.
A critical insight was that the traditional multi-page formats familiar to accounting professionals commonly impose a cognitive workload on other people that can be comparable with conversing in a foreign language. The solution: all necessary information on a single sheet, which calls for A3 format. And, in this format, colour is practically essential to draw and lead the eye.
The Directors' View - with Contribution Streaming is in a carefully structured hierarchy:
KEY DATA - the big picture, the absolute essentials
PROFIT AND LOSS ANALYSIS - the source of insight
EXPENSES DETAIL - the prelude to action.

Key Data
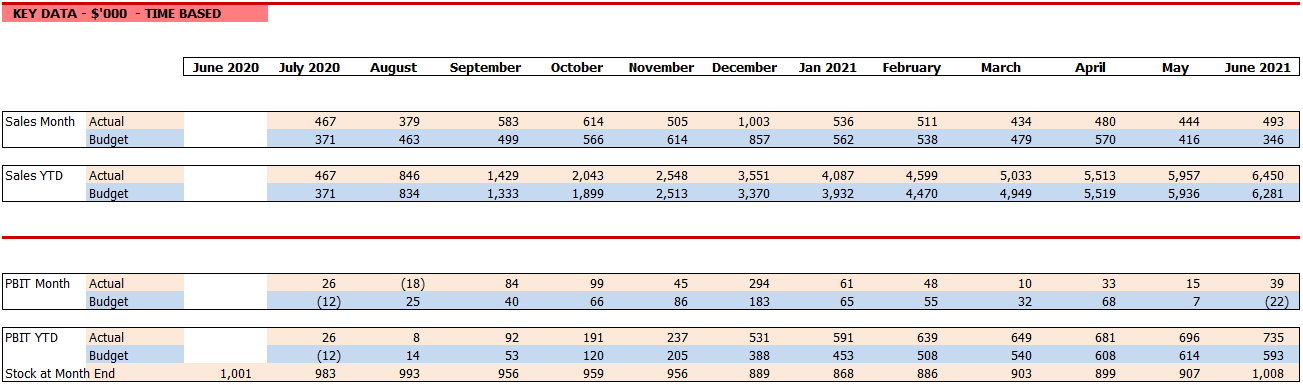
Directors need instant access to the lines that are top and bottom of traditional financial reports: Sales and Profits.
Context
And need them in context; they need a time-based series from which they can see:
How do results compare with plan?
How are they trending and will the full year plan be achieved?
What is the impact of seasonality?
What monthly sales are needed to break-even?
Accuracy
Given that the accuracy of reported profit in a trading business depends dollar-for-dollar with the stock valuation, that needs to be displayed, too.
Rounding
Amounts are displayed to the thousand, to facilitate discussion and memory.
Interactive Presentation
Too much information? An interactive presentation enables:
The progressive unveiling of information
The ability to toggle between graphic or numeric presentations
Displays of seasonal variations
Calculation of the break-even point and forward projections

Profit & Loss Analysis
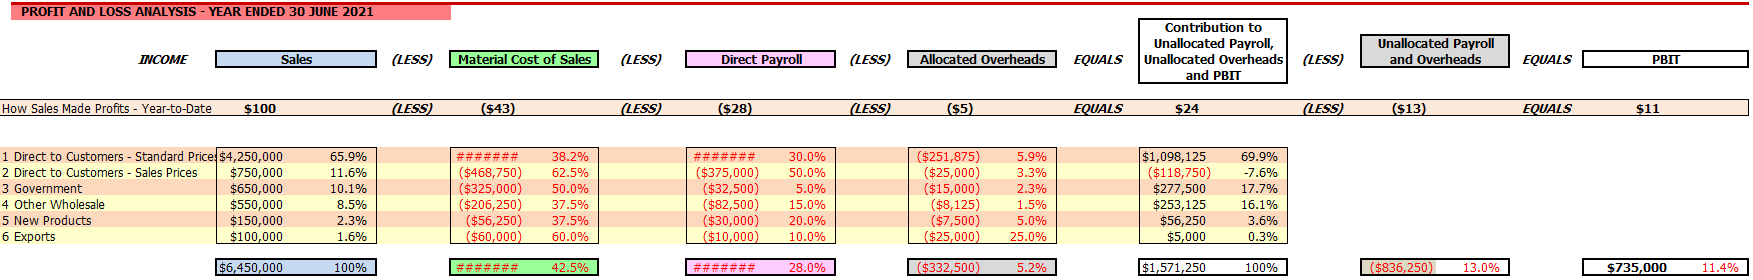
Built on the concept of CONTRIBUTION STREAMING this shows HOW the business is making its profits.
Using year-to-date information, being the most robust, it provides essential insights as well as being the foundation for a range of powerful analytical tools.
Contribution Categories
It recognises that successful businesses have a reasonable but not excessive number of distinct contribution categories. More than six may suggest a lack of focus; less than three, critical customer dependencies.
Different Margins
Of vital importance, Contribution Streaming identifies and analyses the impact of different margins.
Sometimes products themselves command different selling prices
But often it's the market segment: wholesale vs retail
Or the geographic sector: domestic vs export
Or the customer category: distributer vs one-off customers.
As the Example Company Pty Ltd shows, the contribution rates are commonly dramatically different.
Five-Fold Increase in Profitability
We have applied this level of Contribution Streaming analysis to increase the profitability of a business five-fold.
The more sophisticated analytical tools that are built on the foundation of foundation of Contribution Streaming include:
Upwards Analysis of a Contribution Stream - showing it in context of its market competitors
Downwards Analysis - its composition by customers
Matrix Analysis - in which alternate definitions of the contribution categories
Price Change Analysis.
Element Analysis
At the foot of this section is a display showing how the main elements of Sales, Materials, Production Payroll, and Allocated Overheads generate the Contributions that covers Other Overheads and leads to Profit.

Expenses Detail
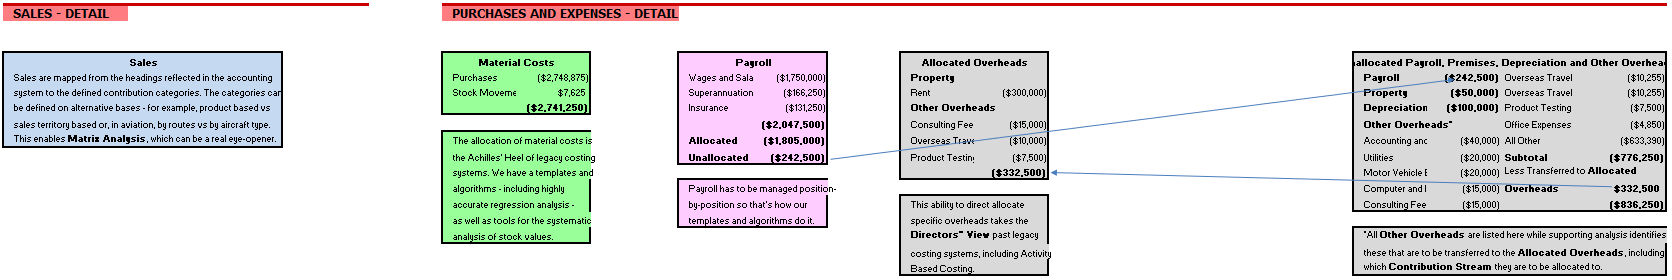
These are obviously essential. However, they are conventionally the starting point of management financial information. The Directors' View - with Contribution Analysis reverses this: once the Key Data have been absorbed and the insights from the Profit and Loss Analysis - with Contribution Streaming gained then the prelude to action is the Expenses - Detail. Thus, big-picture first, then financial analysis, then fine point detail.
Interactive Presentation
In the interactive presentation, these lists pop-up on command.